United States Crime Rate
(C)Copyright 2002 by Carl Drews
Last update: November 14, 2003
This web page posts the crime rate in the United States of America.
Contents:Crime Rate Graphs The Economy
Source: Federal Bureau of Investigation, Uniform Crime Report, Index of Crime.
URL: http://www.fbi.gov/ucr/02cius.htm
URL: http://www.fbi.gov/ucr/cius_02/xl/02tbl01.xls
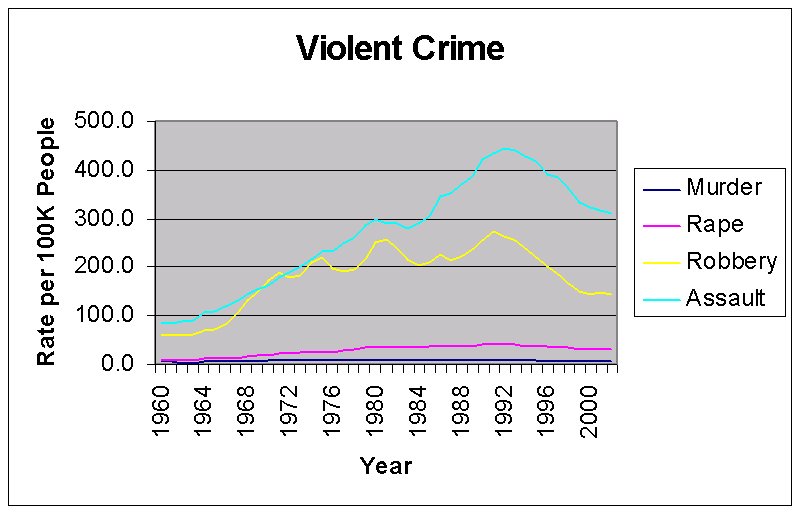
Violent crimes are offenses of murder, forcible rape, robbery, and aggravated assault.
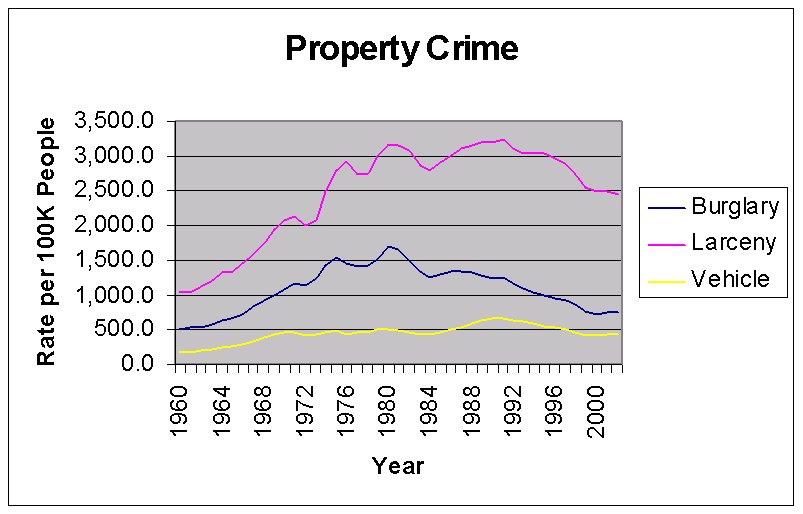
Property crimes are offenses of burglary, larceny-theft, and motor vehicle theft.
The murder and non-negligent homicides that occurred as a result of the events of September 11, 2001, were not included in this table. See special report, Section V.
There may be some under-reporting in the earlier part of the table and graphs below. Although the Uniform Crime Reporting (UCR) Program began in 1930, not all law enforcement agences contributed reports from the beginning. So there may be an artificial ramp-up effect going on here. Conversely, a drop in crime is definitely real, and bigger than these figures would indicate. (Maybe someday I can adjust the figures by the number of reporting agencies.)
|
Year |
Crime Index total |
Violent crime |
Property crime |
Murder and non- negligent man- slaughter |
Forcible rape |
Robbery |
Aggravated assault |
Burglary |
Larceny-theft |
Motor vehicle theft |
|
1960 |
1,887.2 |
160.9 |
1,726.3 |
5.1 |
9.6 |
60.1 |
86.1 |
508.6 |
1,034.7 |
183.0 |
|
1961 |
1,906.1 |
158.1 |
1,747.9 |
4.8 |
9.4 |
58.3 |
85.7 |
518.9 |
1,045.4 |
183.6 |
|
1962 |
2,019.8 |
162.3 |
1,857.5 |
4.6 |
9.4 |
59.7 |
88.6 |
535.2 |
1,124.8 |
197.4 |
|
1963 |
2,180.3 |
168.2 |
2,012.1 |
4.6 |
9.4 |
61.8 |
92.4 |
576.4 |
1,219.1 |
216.6 |
|
1964 |
2,388.1 |
190.6 |
2,197.5 |
4.9 |
11.2 |
68.2 |
106.2 |
634.7 |
1,315.5 |
247.4 |
|
1965 |
2,449.0 |
200.2 |
2,248.8 |
5.1 |
12.1 |
71.7 |
111.3 |
662.7 |
1,329.3 |
256.8 |
|
1966 |
2,670.8 |
220.0 |
2,450.9 |
5.6 |
13.2 |
80.8 |
120.3 |
721.0 |
1,442.9 |
286.9 |
|
1967 |
2,989.7 |
253.2 |
2,736.5 |
6.2 |
14.0 |
102.8 |
130.2 |
826.6 |
1,575.8 |
334.1 |
|
1968 |
3,370.2 |
298.4 |
3,071.8 |
6.9 |
15.9 |
131.8 |
143.8 |
932.3 |
1,746.6 |
393.0 |
|
1969 |
3,680.0 |
328.7 |
3,351.3 |
7.3 |
18.5 |
148.4 |
154.5 |
984.1 |
1,930.9 |
436.2 |
|
1970 |
3,984.6 |
363.5 |
3,621.0 |
7.9 |
18.7 |
172.1 |
164.8 |
1,084.9 |
2,079.3 |
456.8 |
|
1971 |
4,164.7 |
396.0 |
3,768.8 |
8.6 |
20.5 |
188.0 |
178.8 |
1,163.5 |
2,145.5 |
459.8 |
|
1972 |
3,961.4 |
401.0 |
3,560.4 |
9.0 |
22.5 |
180.7 |
188.8 |
1,140.8 |
1,993.6 |
426.1 |
|
1973 |
4,154.4 |
417.4 |
3,737.0 |
9.4 |
24.5 |
183.1 |
200.5 |
1,222.5 |
2,071.9 |
442.6 |
|
1974 |
4,850.5 |
461.1 |
4,389.4 |
9.8 |
26.2 |
209.3 |
215.8 |
1,437.7 |
2,489.5 |
462.2 |
|
1975 |
5,298.5 |
487.8 |
4,810.6 |
9.6 |
26.3 |
220.8 |
231.1 |
1,532.1 |
2,804.8 |
473.7 |
|
1976 |
5,287.3 |
467.8 |
4,819.5 |
8.7 |
26.6 |
199.3 |
233.2 |
1,448.2 |
2,921.3 |
450.0 |
|
1977 |
5,077.6 |
476.0 |
4,601.7 |
8.9 |
29.4 |
190.7 |
247.0 |
1,419.8 |
2,729.9 |
451.9 |
|
1978 |
5,140.3 |
497.8 |
4,642.5 |
9.0 |
31.0 |
195.8 |
262.1 |
1,434.6 |
2,747.4 |
460.5 |
|
1979 |
5,565.5 |
548.9 |
5,016.6 |
9.8 |
34.7 |
218.4 |
286.0 |
1,511.9 |
2,999.1 |
505.6 |
|
1980 |
5,950.0 |
596.6 |
5,353.4 |
10.2 |
36.8 |
251.1 |
298.5 |
1,684.1 |
3,167.0 |
502.2 |
|
1981 |
5,858.2 |
594.3 |
5,263.8 |
9.8 |
36.0 |
258.7 |
289.7 |
1,649.5 |
3,139.7 |
474.7 |
|
1982 |
5,600.5 |
570.8 |
5,029.7 |
9.1 |
34.0 |
238.8 |
289.0 |
1,488.0 |
3,083.1 |
458.6 |
|
1983 |
5,179.2 |
538.1 |
4,641.1 |
8.3 |
33.8 |
216.7 |
279.4 |
1,338.7 |
2,871.3 |
431.1 |
|
1984 |
5,038.4 |
539.9 |
4,498.5 |
7.9 |
35.7 |
205.7 |
290.6 |
1,265.5 |
2,795.2 |
437.7 |
|
1985 |
5,224.5 |
558.1 |
4,666.4 |
8.0 |
36.8 |
209.3 |
304.0 |
1,291.7 |
2,911.2 |
463.5 |
|
1986 |
5,501.9 |
620.1 |
4,881.8 |
8.6 |
38.1 |
226.0 |
347.4 |
1,349.8 |
3,022.1 |
509.8 |
|
1987 |
5,575.5 |
612.5 |
4,963.0 |
8.3 |
37.6 |
213.7 |
352.9 |
1,335.7 |
3,095.4 |
531.9 |
|
1988 |
5,694.5 |
640.6 |
5,054.0 |
8.5 |
37.8 |
222.1 |
372.2 |
1,316.2 |
3,151.7 |
586.1 |
|
1989 |
5,774.0 |
666.9 |
5,107.1 |
8.7 |
38.3 |
234.3 |
385.6 |
1,283.6 |
3,189.6 |
634.0 |
|
1990 |
5,802.7 |
729.6 |
5,073.1 |
9.4 |
41.1 |
256.3 |
422.9 |
1,232.2 |
3,185.1 |
655.8 |
|
1991 |
5,898.4 |
758.2 |
5,140.2 |
9.8 |
42.3 |
272.7 |
433.4 |
1,252.1 |
3,229.1 |
659.0 |
|
1992 |
5,661.4 |
757.7 |
4,903.7 |
9.3 |
42.8 |
263.7 |
441.9 |
1,168.4 |
3,103.6 |
631.6 |
|
1993 |
5,487.1 |
747.1 |
4,740.0 |
9.5 |
41.1 |
256.0 |
440.5 |
1,099.7 |
3,033.9 |
606.3 |
|
1994 |
5,373.8 |
713.6 |
4,660.2 |
9.0 |
39.3 |
237.8 |
427.6 |
1,042.1 |
3,026.9 |
591.3 |
|
1995 |
5,274.9 |
684.5 |
4,590.5 |
8.2 |
37.1 |
220.9 |
418.3 |
987.0 |
3,043.2 |
560.3 |
|
1996 |
5,087.6 |
636.6 |
4,451.0 |
7.4 |
36.3 |
201.9 |
391.0 |
945.0 |
2,980.3 |
525.7 |
|
1997 |
4,927.3 |
611.0 |
4,316.3 |
6.8 |
35.9 |
186.2 |
382.1 |
918.8 |
2,891.8 |
505.7 |
|
1998 |
4,620.1 |
567.6 |
4,052.5 |
6.3 |
34.5 |
165.5 |
361.4 |
863.2 |
2,729.5 |
459.9 |
|
1999 |
4,266.5 |
523.0 |
3,743.6 |
5.7 |
32.8 |
150.1 |
334.3 |
770.4 |
2,550.7 |
422.5 |
|
2000 |
4,124.8 |
506.5 |
3,618.3 |
5.5 |
32.0 |
145.0 |
324.0 |
728.8 |
2,477.3 |
412.2 |
|
2001 |
4,162.6 |
504.5 |
3,658.1 |
5.6 |
31.8 |
148.5 |
318.6 |
741.8 |
2,485.7 |
430.5 |
|
2002 |
4,118.8 |
494.6 |
3,624.1 |
5.6 |
33.0 |
145.9 |
310.1 |
746.2 |
2,445.8 |
432.1 |
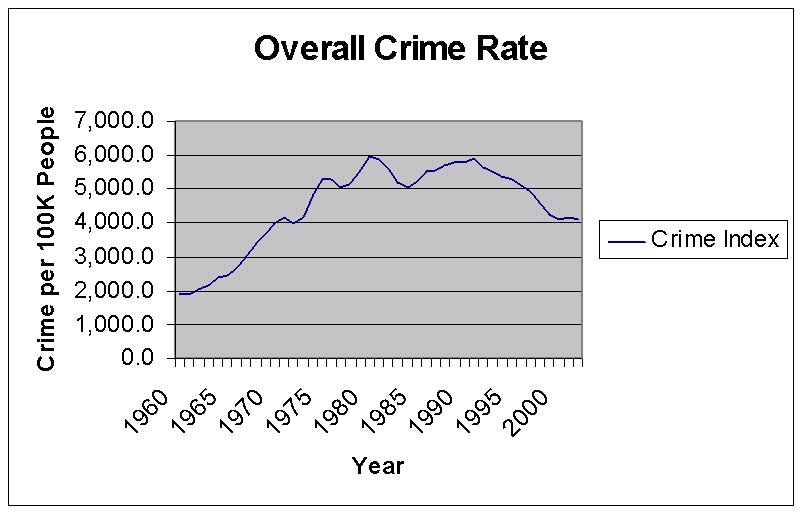
Here are some graphs of those tables, to help you visualize what's been happening.
Some analysts have suggested that the strength of the U.S. economy is closely correlated with the crime rate. Note that an observed correlation does not necessarily specify which is the cause and which is the effect. I would assume that a good economy causes people to commit fewer crimes because they are happily employed. However, it could also be that crimes interfere with business and thereby damage the economy. There could also be a third unknown cause for both. Here's the graph:
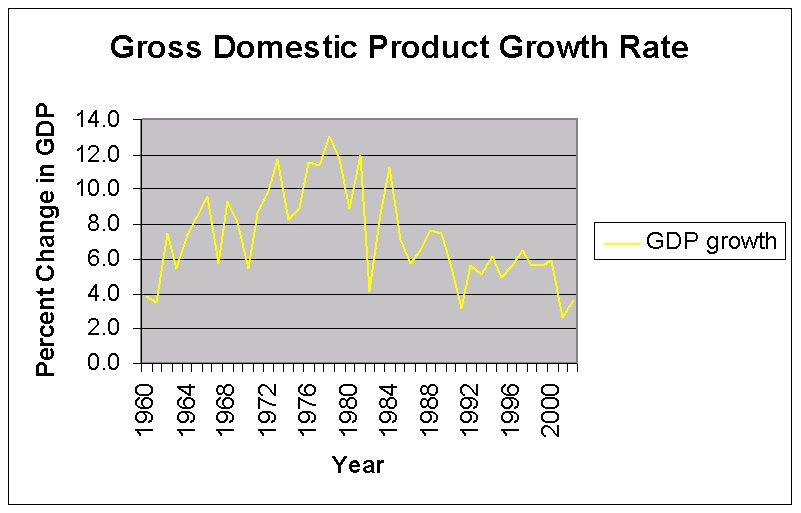
If you compare visually the economy graph to the crime graphs above for the period 1984-2000, it appears that the correlation theory has some merit. One graph goes up while the other goes down, meaning that a strong economy means low crime. Interesting. Feel free to scrape the numbers off the page and calculate the numerical correlation yourself.
It also might be true that stability means lower crime; while upheaval, even good economic upheaval, means higher crime. Hmmm . . .