6. You shall not commit murder.
(C)Copyright 2003 by Carl Drews
Last update: January 15, 2006
This web page describes the methodology and data sources used to measure the behavior of the people of the United States in following the Sixth Commandment.
Contents: Index Value, Graph, Methodology, Data Sources, Calculations, Abortion, Terrorism
Current Value: +119.6359 lives per thousand people.
This index was last updated on March 16, 2004.

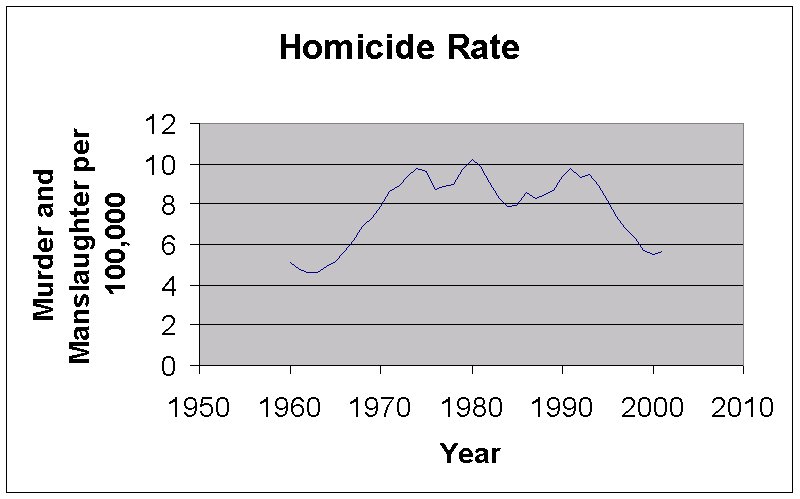
In this commandment the positive component of the index (Lives Saved) overwhelms the negative component (Murder). That's a good thing! The graph of the Total Index matches the graph of Lives Saved very closely. Here is the homicide rate graphed separately so you can see what it looks like on its own.
Murder is the intentional taking of another person's life. The opposite of murder is saving another person's life, or preserving a life that would otherwise have been lost.
Murder is easy to count. We have homicide statistics for the United States published by the Federal Bureau of Investigation as part of their Uniform Crime Report. The negative component of the Sixth Commandment is the murder rate.
The Sixth Commandment is understood by Biblical scholars not to include deaths in war, nor to deaths by legal execution carried out by the state. Obviously a country can declare an unjust war and kill a lot of people immorally, and there are cases where nations have unjustly executed a prisoner. The Morality Index does not count these because individual murder is the original understanding of the commandment, and the murder rate gives us a good picture of how we follow it. For the matter of abortion, please see the section below.
The positive component of the Sixth Commandment is saving people who would have died. When I was a kid my family subscribed to Boy's Life magazine, a monthly publication for Boy Scouts. On the last page of each issue they had an exciting and true story of a Boy Scout who actually saved someone's life! These were heroic illustrations of brave young men diving to snatch a toddler from an oncoming train, or pulling children out of an icy pond, or braving winter storms to bring a desperately ill person to the hospital. The last frame always showed the smiling Boy Scout proudly wearing his medal. Certainly we want to count these selfless acts, where people risk their lives to save someone in trouble!
And yet, most of the life-saving action in the United States is not these dramatic acts of heroism. Most of the lives saved are due to the policies that our society creates in terms of safety, good living conditions, and health care. These policies are not as dramatic as a Boy Scout pulling a baby out of a burning building. However, these policies make the difference between bringing a recovering person home from the hospital, and standing by an open grave while a casket is lowered into the earth. I'll take the boring policies if they save lives.
The Morality Index measures lives saved by looking at the life expectancy of the United States. If people's lives are saved, then they live longer. A society is doing well at saving lives if everyone lives to be a hundred years old. This measure turns out to be a rare case of over-counting within the Morality Index: instead of counting only the recorded Boy Scout rescues, every person's age at death is factored in.
The life expectancy provides a measure of lives saved from all causes, but what's the baseline? What would be the average age at death if nobody were even trying to save lives? The Bible seems to give us a clue in Genesis 6:3:
Then the LORD said, "My Spirit will not contend with man forever, for he is mortal; his days will be a hundred and twenty years."Since it's very rare for people to live 120 years, I must conclude that Genesis 6:3 refers to the ideal lifespan; how long a person would live without disease, accidents, poor nutrition, family problems, congenital defects, and so on. That's the maximum possible lifespan, and it is not used in the calculation.
Since I don't know what is the average lifespan without any effort at life-saving going on, I'll arbitrarily pick the life expectancy in 1950 as the baseline. This is the middle of the twentieth century. The baseline year only adjusts the entire graph up and down, and does not affect relative comparisons between decades. As long as we pick a baseline and stick to it, we're okay. Index values below zero are not "immoral", they are simply less moral than index values above zero.
One may ask if life expectancy is a fair measure if morality. Isn't life expectancy always going to go up? Isn't that natural?
No, it's not natural for people to live longer and longer. There are countries in Africa, usually in the turmoil of civil war, where the life expectancy has dropped over certain periods of their history. There is nothing instrinsic about the North American continent that's getting healthier and healthier over time. Smallpox and polio have been defeated, but West Nile virus and other diseases are emerging and taking hold in the population. People haven't changed much genetically from 1900 to 2000. There's nothing inevitable about Americans living longer and longer.
Americans value life highly. We expend a lot of effort preserving life. When I look around my office cubicle I see a fire alarm, a smoke detector, water sprinklers in the ceiling, and exit lights near the doors. When I stand up and look over the partitions I can see even more: a tornado shelter, doors that close automatically in case of fire, multiple exit stairways, safety glass, guardrails and speed limit signs on the highway nearby. There is even more in the building that I can't see: air filtration, fireproof materials, reinforced construction in case of earthquake, fire hydrants, and a fire extinguisher down the hall. I'm really safe right here in my office!
Our society requires people by law to wear seatbelts, even when they don't want to. There are multiple waves of building inspectors in any new construction. Bicycles may not be sold legally without reflectors. Health insurance is commonly supplied with employment. Ferry boat operators can get fined if they load too many people. We really do put a lot of money and effort into saving people's lives. And it really pays off!
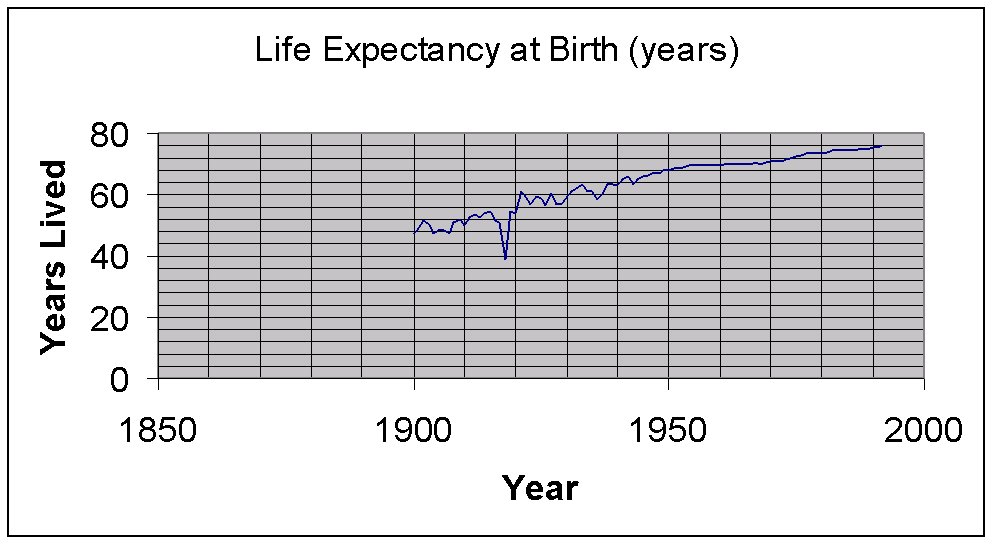
The figures on Life Expectancy come from the National Center for Health Statistics, the National Vital Statistics Report. This report contains data for the entire 20th century.
|
Year |
Life Expectancy at Birth (years) |
|
1900 |
47.3 |
|
1901 |
49.1 |
|
1902 |
51.5 |
|
1903 |
50.5 |
|
1904 |
47.6 |
|
1905 |
48.7 |
|
1906 |
48.7 |
|
1907 |
47.6 |
|
1908 |
51.1 |
|
1909 |
52.1 |
|
1910 |
50 |
|
1911 |
52.6 |
|
1912 |
53.5 |
|
1913 |
52.5 |
|
1914 |
54.2 |
|
1915 |
54.5 |
|
1916 |
51.7 |
|
1917 |
50.9 |
|
1918 |
39.1 |
|
1919 |
54.7 |
|
1920 |
54.1 |
|
1921 |
60.8 |
|
1922 |
59.6 |
|
1923 |
57.2 |
|
1924 |
59.7 |
|
1925 |
59 |
|
1926 |
56.7 |
|
1927 |
60.4 |
|
1928 |
56.8 |
|
1929 |
57.1 |
|
1930 |
59.7 |
|
1931 |
61.1 |
|
1932 |
62.1 |
|
1933 |
63.3 |
|
1934 |
61.1 |
|
1935 |
61.7 |
|
1936 |
58.5 |
|
1937 |
60 |
|
1938 |
63.5 |
|
1939 |
63.7 |
|
1940 |
62.9 |
|
1941 |
64.8 |
|
1942 |
66.2 |
|
1943 |
63.3 |
|
1944 |
65.2 |
|
1945 |
65.9 |
|
1946 |
66.7 |
|
1947 |
66.8 |
|
1948 |
67.2 |
|
1949 |
68 |
|
1950 |
68.2 |
|
1951 |
68.4 |
|
1952 |
68.6 |
|
1953 |
68.8 |
|
1954 |
69.6 |
|
1955 |
69.6 |
|
1956 |
69.7 |
|
1957 |
69.5 |
|
1958 |
69.6 |
|
1959 |
69.9 |
|
1960 |
69.7 |
|
1961 |
70.2 |
|
1962 |
70.1 |
|
1963 |
69.9 |
|
1964 |
70.2 |
|
1965 |
70.2 |
|
1966 |
70.2 |
|
1967 |
70.5 |
|
1968 |
70.2 |
|
1969 |
70.5 |
|
1970 |
70.8 |
|
1971 |
71.1 |
|
1972 |
71.2 |
|
1973 |
71.4 |
|
1974 |
72 |
|
1975 |
72.6 |
|
1976 |
72.9 |
|
1977 |
73.3 |
|
1978 |
73.5 |
|
1979 |
73.9 |
|
1980 |
73.7 |
|
1981 |
74.1 |
|
1982 |
74.5 |
|
1983 |
74.6 |
|
1984 |
74.7 |
|
1985 |
74.7 |
|
1986 |
74.7 |
|
1987 |
74.9 |
|
1988 |
74.9 |
|
1989 |
75.1 |
|
1990 |
75.4 |
|
1991 |
75.5 |
|
1992 |
75.8 |
|
1993 |
75.5 |
|
1994 |
75.7 |
|
1995 |
75.8 |
|
1996 |
76.1 |
|
1997 |
76.5 |
|
1998 |
76.7 |
|
1999 |
76.7 |
|
2000 |
76.9 |
|
2001 |
77.2 |
|
2002 |
77.4 |
When I first saw this table I was horrified to see that the life expectancy for the year 1900 was only 47.3 years! That's really young. What makes the number even more grim is that people back then did not usually die of old age at around 47 years old. No, the low average age at death is due to infant and childhood deaths. Walk around any old cemetery and you will see. Lots of children died very young in the early 1900s. They died of polio, fever, severe colds, accidents, and complications from childbirth. The 1-year birthday served as a marker for officially surviving infancy. Many babies did not make it.
On a happier note, we see that the life expectancy for babies born in the year 2000 is 76.9 years. The American society has increased our life expectancy from 47 to 77 years during the twentieth century. This has to be recognized as a stunning achievement! We are saving lives, and lots of them! You can expect to enjoy a loved one's company for 30 years longer than you did a century ago. That's great.
When I graphed the life expectancy over time I immediately noticed a severe drop during the year 1918. That was the year of the worldwide flu epidemic, which also occurred at the height of World War I. The slaughter in the trenches of "The Great War" combined with the slaughter at home by the flu virus to reduce the average life expectancy by 10 years! That's what happened in 1918.
On our graph we see that 1918 counts as a very immoral year, the worst ever recorded by far. Is that fair? Were my grandparents really so immoral that year?
Remember that we are measuring immoral behavior and its consequences. Those consequences may not show up right away, and they may show up all at once when they do. The devastating effects of the flu epidemic were greatly amplified by all the traveling around the world at that time. Why were people traveling so much? The world was fighting "The Great War", a war that started without a good purpose and ended without accomplishing much of lasting value. The war was vastly immoral, and many people died because of it. The United States entered the war in probably a just cause (to end it), and we paid the price for mankind's sinful behavior. So did everyone else. Sin costs.
The homicide rate comes from the Uniform Crime Report published by the Federal Bureau of Investigation. The FBI publishes the murder rate as "Murder and non-negligent manslaughter", and they specify the rate per 100,000 inhabitants.
|
Year |
Murder and non-negligent manslaughter |
|
1960 |
5.1 |
|
1961 |
4.8 |
|
1962 |
4.6 |
|
1963 |
4.6 |
|
1964 |
4.9 |
|
1965 |
5.1 |
|
1966 |
5.6 |
|
1967 |
6.2 |
|
1968 |
6.9 |
|
1969 |
7.3 |
|
1970 |
7.9 |
|
1971 |
8.6 |
|
1972 |
9.0 |
|
1973 |
9.4 |
|
1974 |
9.8 |
|
1975 |
9.6 |
|
1976 |
8.7 |
|
1977 |
8.9 |
|
1978 |
9.0 |
|
1979 |
9.8 |
|
1980 |
10.2 |
|
1981 |
9.8 |
|
1982 |
9.1 |
|
1983 |
8.3 |
|
1984 |
7.9 |
|
1985 |
8.0 |
|
1986 |
8.6 |
|
1987 |
8.3 |
|
1988 |
8.5 |
|
1989 |
8.7 |
|
1990 |
9.4 |
|
1991 |
9.8 |
|
1992 |
9.3 |
|
1993 |
9.5 |
|
1994 |
9.0 |
|
1995 |
8.2 |
|
1996 |
7.4 |
|
1997 |
6.8 |
|
1998 |
6.3 |
|
1999 |
5.7 |
|
2000 |
5.5 |
|
2001 |
5.6 |
This section works through all the adjustments and calculations made, from the original datum through the final index value, so interested readers may follow and verify the methodology used. We will use the year 1984 because it happens to be a low point between two peaks on the homicide graph.
According to the National Center for Health Statistics, the life expectancy at birth in 1984 was 74.7 years. We subtract the baseline life expectancy at year 1950, and divide by the life expectancy in the year 2000 to convert from years to lives.
(74.7 years - 68.2 years in 1950) / 76.9 years in 2000 = 0.084525358 lives saved in 1984 relative to 1950, expressed as a fraction of the year 2000 life-span
That number is the lives saved per person, including murder because we have started with the life expectancy including deaths from murder. The next step is to adjust to 1,000 people. Recall that the Morality Index seeks to use positive and negative components that are not directly derived from each other. So if we want to obtain the life expectancy excluding murder, we must add in the homicide rate (the people who died of murder would have lived on).
0.084525358 lives saved per person * 1,000 = 84.525358 lives saved per 1,000 people
84.525358 lives saved per 1,000 people, including murder + 0.079262198 murders per 1,000 = 84.60462 lives saved per 1,000 people if there were no murder
According to the Federal Bureau of Investigation, the murder rate in 1984 was 7.926219768 per 100,000 inhabitants. We divide by 100 to obtain the lives taken per 1,000 inhabitants.
7.926219768 murders per 100,000 inhabitants / 100 = 0.07926219768 lives taken per 1,000 inhabitants
Now that we have the indexes for life expectancy and murder expressed in the same units, it's a simple matter to add them together to get the final composite index.
1984 Morality Index for Commandment 6 = 1984 Life Expectancy Index - 1984 Murder Index
= 84.60462 - 0.07926219768 = 84.52536
It's easy to see that the final step merely gets us back to the overall number for life expectancy, since we subtract the homicide rate that we added earlier. One could skip the two canceling steps, but it's interesting to see the murder rate separately, and good to keep a consistent methodology.
The table below contains the final index values for the Sixth Commandment over several decades. As you can see, the Murder numbers don't kick in until 1960, so we don't really have a valid composite index until that year. However, the positive component is still interesting by itself (see graph at top of page).
|
Year |
Lives saved per 1,000 |
Lives murdered per 1,000 |
6. You shall not kill |
|
1900 |
-271.782 |
0 |
-271.782 |
|
1901 |
-248.375 |
0 |
-248.375 |
|
1902 |
-217.165 |
0 |
-217.165 |
|
1903 |
-230.169 |
0 |
-230.169 |
|
1904 |
-267.88 |
0 |
-267.88 |
|
1905 |
-253.576 |
0 |
-253.576 |
|
1906 |
-253.576 |
0 |
-253.576 |
|
1907 |
-267.88 |
0 |
-267.88 |
|
1908 |
-222.367 |
0 |
-222.367 |
|
1909 |
-209.363 |
0 |
-209.363 |
|
1910 |
-236.671 |
0 |
-236.671 |
|
1911 |
-202.861 |
0 |
-202.861 |
|
1912 |
-191.157 |
0 |
-191.157 |
|
1913 |
-204.161 |
0 |
-204.161 |
|
1914 |
-182.055 |
0 |
-182.055 |
|
1915 |
-178.153 |
0 |
-178.153 |
|
1916 |
-214.564 |
0 |
-214.564 |
|
1917 |
-224.967 |
0 |
-224.967 |
|
1918 |
-378.414 |
0 |
-378.414 |
|
1919 |
-175.553 |
0 |
-175.553 |
|
1920 |
-183.355 |
0 |
-183.355 |
|
1921 |
-96.2289 |
0 |
-96.2289 |
|
1922 |
-111.834 |
0 |
-111.834 |
|
1923 |
-143.043 |
0 |
-143.043 |
|
1924 |
-110.533 |
0 |
-110.533 |
|
1925 |
-119.636 |
0 |
-119.636 |
|
1926 |
-149.545 |
0 |
-149.545 |
|
1927 |
-101.43 |
0 |
-101.43 |
|
1928 |
-148.244 |
0 |
-148.244 |
|
1929 |
-144.343 |
0 |
-144.343 |
|
1930 |
-110.533 |
0 |
-110.533 |
|
1931 |
-92.3277 |
0 |
-92.3277 |
|
1932 |
-79.3238 |
0 |
-79.3238 |
|
1933 |
-63.7191 |
0 |
-63.7191 |
|
1934 |
-92.3277 |
0 |
-92.3277 |
|
1935 |
-84.5254 |
0 |
-84.5254 |
|
1936 |
-126.138 |
0 |
-126.138 |
|
1937 |
-106.632 |
0 |
-106.632 |
|
1938 |
-61.1183 |
0 |
-61.1183 |
|
1939 |
-58.5176 |
0 |
-58.5176 |
|
1940 |
-68.9207 |
0 |
-68.9207 |
|
1941 |
-44.2133 |
0 |
-44.2133 |
|
1942 |
-26.0078 |
0 |
-26.0078 |
|
1943 |
-63.7191 |
0 |
-63.7191 |
|
1944 |
-39.0117 |
0 |
-39.0117 |
|
1945 |
-29.909 |
0 |
-29.909 |
|
1946 |
-19.5059 |
0 |
-19.5059 |
|
1947 |
-18.2055 |
0 |
-18.2055 |
|
1948 |
-13.0039 |
0 |
-13.0039 |
|
1949 |
-2.60078 |
0 |
-2.60078 |
|
1950 |
0 |
0 |
0 |
|
1951 |
2.60078 |
0 |
2.60078 |
|
1952 |
5.20156 |
0 |
5.20156 |
|
1953 |
7.802341 |
0 |
7.802341 |
|
1954 |
18.20546 |
0 |
18.20546 |
|
1955 |
18.20546 |
0 |
18.20546 |
|
1956 |
19.50585 |
0 |
19.50585 |
|
1957 |
16.90507 |
0 |
16.90507 |
|
1958 |
18.20546 |
0 |
18.20546 |
|
1959 |
22.10663 |
0 |
22.10663 |
|
1960 |
19.55665 |
-0.0508 |
19.50585 |
|
1961 |
26.05556 |
-0.04776 |
26.0078 |
|
1962 |
24.75333 |
-0.04592 |
24.70741 |
|
1963 |
22.15247 |
-0.04584 |
22.10663 |
|
1964 |
26.05677 |
-0.04897 |
26.0078 |
|
1965 |
26.05927 |
-0.05147 |
26.0078 |
|
1966 |
26.06425 |
-0.05645 |
26.0078 |
|
1967 |
29.97096 |
-0.06199 |
29.90897 |
|
1968 |
26.07701 |
-0.06921 |
26.0078 |
|
1969 |
29.98227 |
-0.07329 |
29.90897 |
|
1970 |
33.88887 |
-0.07873 |
33.81014 |
|
1971 |
37.79754 |
-0.08622 |
37.71131 |
|
1972 |
39.10136 |
-0.08966 |
39.0117 |
|
1973 |
41.70607 |
-0.09359 |
41.61248 |
|
1974 |
49.51279 |
-0.09797 |
49.41482 |
|
1975 |
57.3134 |
-0.09624 |
57.21717 |
|
1976 |
61.20582 |
-0.08749 |
61.11834 |
|
1977 |
66.40869 |
-0.0888 |
66.3199 |
|
1978 |
69.01038 |
-0.0897 |
68.92068 |
|
1979 |
74.21974 |
-0.0975 |
74.12224 |
|
1980 |
71.6237 |
-0.10224 |
71.52146 |
|
1981 |
76.82129 |
-0.09828 |
76.72302 |
|
1982 |
82.01527 |
-0.09069 |
81.92458 |
|
1983 |
83.30755 |
-0.08259 |
83.22497 |
|
1984 |
84.60462 |
-0.07926 |
84.52536 |
|
1985 |
84.60511 |
-0.07976 |
84.52536 |
|
1986 |
84.6112 |
-0.08584 |
84.52536 |
|
1987 |
87.20908 |
-0.08294 |
87.12614 |
|
1988 |
87.2107 |
-0.08456 |
87.12614 |
|
1989 |
89.81403 |
-0.08711 |
89.72692 |
|
1990 |
93.72204 |
-0.09395 |
93.62809 |
|
1991 |
95.02645 |
-0.09797 |
94.92848 |
|
1992 |
98.92281 |
-0.09317 |
98.82965 |
|
1993 |
95.02362 |
-0.09514 |
94.92848 |
|
1994 |
97.61886 |
-0.0896 |
97.52926 |
|
1995 |
98.91186 |
-0.08221 |
98.82965 |
|
1996 |
102.8049 |
-0.07407 |
102.7308 |
|
1997 |
108.0004 |
-0.068 |
107.9324 |
|
1998 |
110.596 |
-0.06281 |
110.5332 |
|
1999 |
110.5901 |
-0.05692 |
110.5332 |
|
2000 |
113.1893 |
-0.05538 |
113.1339 |
|
2001 |
117.0913 |
-0.05621 |
117.0351 |
|
2002 |
119.6921 |
-0.05619 |
119.6359 |
As of September 2003 it bothers me numerically that the Lives Saved index value is so much greater than the Murder index value. I'm very happy that many more lives are being saved than being taken away! Yet I wonder if the positive component of this commandment is counting too much, and if it will render the other components of the Morality Index insignificant? It could be that murder is statistically unimportant in this country when compared to improved health care and safety. I plan to develop index values for the other commandments and revisit this one when I have those numbers.
Abortion was legalized throughout the United States by the Supreme Court decision Roe vs. Wade on January 22, 1973. The Alan Guttmacher Institute has excellent statistical information on abortions performed in this country since that time. I obtained my data from the following report:
Finer, Lawrence B. and Stanley K. Henshaw (2003), "Abortion Incidence and Services in the United States in 2000." That report is on-line at the Alan Guttmacher Institute:The following table contains the American abortion rate.
http://www.agi-usa.org/pubs/journals/3500603.pdf
|
Year |
No. (in 000s) |
Rate* |
Ratio† |
Rate per thousand people |
|
1973 |
744.6 |
16.3 |
19.3 |
3.179454 |
|
1974 |
898.6 |
19.3 |
22 |
3.764629 |
|
1975 |
1,034.20 |
21.7 |
24.9 |
4.23277 |
|
1976 |
1,179.30 |
24.2 |
26.5 |
4.720416 |
|
1977 |
1,316.70 |
26.4 |
28.6 |
5.149545 |
|
1978 |
1,409.60 |
27.7 |
29.2 |
5.403121 |
|
1979 |
1,497.70 |
28.8 |
29.6 |
5.617685 |
|
1980 |
1,553.90 |
29.3 |
30 |
5.715215 |
|
1981 |
1,577.30 |
29.3 |
30.1 |
5.715215 |
|
1982 |
1,573.90 |
28.8 |
30 |
5.617685 |
|
1983 |
1,575 |
28.5 |
30.4 |
5.559168 |
|
1984 |
1,577.20 |
28.1 |
29.7 |
5.481144 |
|
1985 |
1,588.60 |
28 |
29.7 |
5.461638 |
|
1986 |
1,574 |
27.4 |
29.4 |
5.344603 |
|
1987 |
1,559.10 |
26.9 |
28.8 |
5.247074 |
|
1988 |
1,590.80 |
27.3 |
28.6 |
5.325098 |
|
1989 |
1,567 |
26.8 |
27.5 |
5.227568 |
|
1990 |
1,609 |
27.4 |
28 |
5.344603 |
|
1991 |
1,556.50 |
26.3 |
27.4 |
5.130039 |
|
1992 |
1,528.90 |
25.7 |
27.5 |
5.013004 |
|
1993 |
1,495 |
25 |
27.4 |
4.876463 |
|
1994 |
1,423 |
23.7 |
26.6 |
4.622887 |
|
1995 |
1,359.40 |
22.5 |
25.9 |
4.388817 |
|
1996 |
1,360.20 |
22.4 |
25.9 |
4.369311 |
|
1997 |
1,335 |
21.9 |
25.5 |
4.271782 |
|
1998 |
1,319 |
21.5 |
25.1 |
4.193758 |
|
1999 |
1,314.80 |
21.4 |
24.6 |
4.174252 |
|
2000 |
1,313.00 |
21.3 |
24.5 |
4.154746 |
The Rate* is the number of abortions per thousand woman aged 15-44 per year. The ratio is the number of abortions per 100 pregnancies ending in abortion or live birth; for example, in 1995 25.9% of all viable pregnancies ended in abortion. The right-hand column of that table is mine. I converted the abortion rate per thousand women in their childbearing years into thousand people by a simple constant multiply. I assumed that women have 30 childbearing years. We divide by the life expectancy (76.9 years) to convert the rate to all females, then divide by 2 to convert to all people. These assumptions are close enough for a simple comparison.
27.4 abortions in 1990 per thousand childbearing women * (30/76.9) / 2 = 5.3446 abortions in 1990 per thousand people
Here is the graph of the American abortion rate per thousand people.

As you can see, the abortion rate quickly zoomed up from 16.3 in 1973 to peak at 29.3 in 1980. The rate has declined steadily since then. I think the initial sudden increase during the 1970s was due to some kind of pent-up demand; in other words, the graph would not show a sudden increase there if Roe vs. Wade had come in 1900 instead.
The Morality Index does not count the abortion rate. I understand that murder is the original meaning of the Sixth Commandment at the time it was given. Homicide is still relevant and prevalent today, so it makes a reasonable measure of morality in this area.
I believe that abortion is sinful, that it is equivalent to murder, and that this viewpoint is a reasonable extrapolation of the Sixth Commandment. I can't imagine Jesus approving of abortion. But my viewpoint is still an extrapolation of the Bible's command, and for this reason I do not count abortion in the Morality Index. I have provided a section on Abortion here because it is instructive and relevant. I don't expect that Roe vs. Wade will be overturned until many hearts have changed.
What would it take to include abortion in the index? We certainly have the numbers available, and a quick glance reveals that in 2000 the abortion rate was 75 times greater than the murder rate (4.154746 / 0.055383). Abortion would certainly show up on the scale, and it would overwhelm murder numerically. Furthermore, we should assign the full value of 1.0 lives for each instance of abortion, since we know that aborted babies are at the beginning of their lives. (Murder is also weighted at 1.0 lives as of September 2003. Although we can assume that murder victims are on average halfway through their lives, the societal trauma from murder is great enough to deserve the full weight of 1.0 lives.)
Abortion is not now counted in the Morality Index in either the positive or the negative component of the Sixth Commandment. The legal definition of homicide only refers to killing someone after a live birth, and the Life Expectancy is at birth, not at conception.
To count abortion in the Morality Index we would need the positive component of unwanted pregnancy. The positive component is not the number of wanted babies born, because that requires no moral effort: "Of course we want our baby - we've been trying for years to have one!" No, the positive component would be the number of unwanted pregnancies that end in live birth, where the mother decides either to keep her baby or place it for adoption (or some other arrangement). To illustrate this concept, I'll tell the true story of my friends Clark and Stacie.
Clark and Stacie had been married for a few years when we got to know them. They had been trying and praying to conceive, but there were medical problems that prevented this from happening. So they considered adoption, but quickly learned that it would be a long and expensive process.
Meanwhile, Clark's mother Lonnie was in contact with a family friend named Nadine, who had recently discovered that she was pregnant. Nadine was a young unmarried woman who already had a little baby boy. The idea of another infant was overwhelming to her, and she decided to abort her baby.
Lonnie persuaded Nadine not to go through with the abortion, telling her that Clark and Stacie wanted a baby and were considering adoption. Nadine made a choice: she would have her baby only if Clark and Stacie would adopt it. Nadine knew that Clark and Stacie wanted a child, and she knew that they would take good care of it. So Nadine continued her pregnancy instead. She still did not tell Clark and Stacie about the possibility of adoption, because there were some medical difficulties during the first trimester and she wanted some preliminary assurance that the baby was okay.
As sometimes happens in these cases, shortly thereafter Stacie discovered to her great joy that she was pregnant! They called Lonnie to tell her the wonderful news. Lonnie was happy to hear that she would be a grandmother again, then dropped a bomb of her own: "Nadine wants you to adopt her baby, too!" Clark and Stacie accepted immediately. First no babies, now two! Sure, two babies will be a little overwhelming but . . . fine. Thank God for His great blessings! Then figure out how to handle them.
Nadine gave birth to a little boy, and Clark and Stacie adopted him and named him Ian. Three months after the adoption, Stacie gave birth to a little girl named Bailey. The two "almost-twins" are very cute together.
The "team" of Nadine-Lonnie-Clark-Stacie worked together through some difficult times to turn an abortion scenario into a live birth into a happy family. I believe it is a great thing they have done! Their "score" in the Morality Index for this event would be 1.0 lives, which is probably more than the numerical contribution I will make over an entire lifetime with my charitable giving and other things.
Stacie does not believe that she and Clark deserve any kind of high moral rating here, pointing out that it was God who did it all and caused these events to happen. Nevertheless, they had to cooperate with God's direction and allow His plan to unfold. They love both their children dearly. Sometimes morality involves making a difficult decision at great cost to oneself. At other times morality is simply cooperating with God's good intent.
It would be interesting to know how many unwanted pregnancies eventually end in live birth. Perhaps someday I'll figure out those numbers and formulate the Unwanted Pregnancy Index.
I'm well aware that there are many people who see abortion as an acceptable way to terminate an unwanted pregnancy. I suggest that these "pro-choice" people should also see the decrease in the abortion rate from 1980 to 2000 as a good thing. Nobody claims that abortion is great, that women should aspire to begin and terminate as many pregnancies as they can during their childbearing years. On the face of it we should assume simply that people are being more responsible with their reproduction. That's a moral improvement, whether you are pro-life or pro-choice.
(It's possible that there are some bad reasons for the decrease in abortions. There are many scenarios - it could be that unmarried pregnant women are committing suicide because they are in despair, that they are reverting to "back-alley" abortions, going overseas instead, or that they are being murdered in "honor killings" by male family members. One of Jesus' ancestors was almost burnt alive this way - see the account of Judah and Tamar in Genesis 38 for the full story. I doubt that these are the real reasons for the rate drop, but I can sift through information at the Alan Guttmacher Institute to find out more.)
On September 11, 2001, a group of terrorists hijacked four commercial airliners and crashed them into the World Trade Center towers in New York City, and into the Pentagon in Washington, DC. The fourth jet crashed into a field near Shanksville, Pennsylvania. The hijackers were inspired and directed by Osama bin Laden, who had advance knowledge of the plot. Osama bin Laden is head of the worldwide terrorist organization al-Qaeda, whose members are dedicated to what they call "jihad."
The Federal Bureau of Investigation reported on the September 11 events in Section V of the Uniform Crime Report for that year:
http://www.fbi.gov/ucr/cius_01/01crime5.pdf
The crash of Flight 93 at Shanksville killed 44 passengers and crew (including the 4 hijackers). There are web sites dedicated to the memorial and legacy of the men who fought back and foiled the hijackers' plans:
http://www.flight93memorialproject.org/
http://www.nps.gov/flni/
Investigators believe that the following group of passengers and crew attempted to storm the cockpit and succeeded in crashing the airplane away from population centers:
Those are the facts.
The FBI does not include the September 11 murder victims in its Uniform Crime Report, for the simple reason that the UCR Program attempts to chronicle "ordinary" murder in society, not an act of war committed by an outside enemy: "The statistics of September 11 are not a part of the traditional Crime in the United States publication because they are different from the day-to-day crimes committed in this country." These were not typical murders, and the number 3,047 is not included in the homicide total for the year. I agree with the FBI's reasoning and practice.
I do not include the 3,047 murder victims of September 11, 2001 in the Morality Index for a different reason. Those acts were committed by a group of non-Americans who inflicted their immorality on the people of the United States. This was an act of outsiders, not a crime committed by people who were part of American society. Since the Morality Index attempts to measure the moral behavior of the United States and its people, it is not correct to count the terrorist attacks as being the fault of American society.
Make no mistake: The terrorist attacks of September 11 were murder most foul in the eyes of any god worth worshipping. But the guilt for these crimes rests upon a group (Osama bin Laden and al-Qaeda) that is not American.
This is the only case where I have excluded a crime based on the knowledge that a non-American outsider committed it. I do not attempt to determine whether other crimes and good deeds were committed by citizens, illegal aliens, legal aliens, foreign visitors, or whatever.
Do the terrorist attacks of September 11, 2001 have any positive component with regard to the Morality Index? They certainly do! The passengers of Flight 93 were a group of untrained, unprepared, unarmed and unorganized group of civilians who were brought together by fate on the spur of the moment. Working together, they fought bravely and defeated the plans of a group of armed, trained, prepared, organized, and professional killers. When he said, "Let's roll!" Todd Beamer and company set out on a course of action that would take their own lives but preserve many others. As Jesus said in John 15:13 "The greatest love is shown when people lay down their lives for their friends."
The FBI and other organizations have surmised that the intended target of Flight 93 was the Capitol building in Washington, DC. Since the Capitol as a terrorist target is similar to the Pentagon, we may estimate that 184 lives were saved by the heroes on Flight 93. But that number is not nearly the total number of lives saved on September 11.
The World Trade Center towers, burning fiercely, stayed upright and did not collapse for more than an hour after the impacts. Reporter Ray Bernard, in his article "A Towering Achievement" from Graduating Engineer and Computer Careers magazine (January 11, 2002) says:
"In spite of the nature and magnitude of the forces set against them forces well beyond anything any office buildings could be expected to endure—the Twin Towers held their structural integrity 102 minutes for Tower One and 56 minutes for Tower Two, allowing an estimated 90% of the building's occupants to evacuate."
Those precious minutes gave thousands of people the opportunity to move down the exit stairs to escape the fire and the impending collapse of the Twin Towers. The article further states:
"The heroic, life-saving efforts of the police, firefighters and other emergency personnel will live on in our minds and hearts. The images will always be there. They are for me, replayed over and over.
"But part of what saved those 25,000 were efforts made days and even years before the towers fell in September. It was unnoticed work accomplished by unseen hands, from the engineers and architects who designed and constructed the buildings, to the engineers and technicians who operated and maintained them. Without them, many other life-saving efforts that day would not have been possible."
The entire article can be read online at:
http://www.graduatingengineer.com/articles/feature/01-11-02a.html
The article quotes New York Mayor Rudy Giuliani's estimate that 25,000 lives were saved by the things that Civil Engineers in America do very well: constructing strong buildings, planning for the impact of an airplane, building exit stairs, and devising redundant safety features. Every engineer, inspector, supervisor, and construction worker who built the World Trade Center long ago had a hand in saving those lives. Blueprints and building codes made the difference between many WTC office workers coming home to their families that night, and a much bigger death toll.
On July 21, 2004 Federal investigators at the National Institute of Standards and Technology released the results of their analysis of the evacuation patterns of the World Trade Center. "The agency [NIST] had previously estimated that between 16,200 and 18,600 people were in the buildings." (CNN.com) So I will average those two figures to conclude that 17,400 people were in the Twin Towers when the planes hit. 2,823 people were killed (as calculated by the FBI), and therefore 14,577 people escaped. Although I don't want to over-count the number of lives saved here, it's quite likely that less-robust towers would have collapsed immediately, or fallen onto other buildings nearby. Lacking further information, I have to conclude that those 14,577 people owe their lives to the architects and civil engineers who built the World Trade Center! Therefore the total lives saved on September 11 are as follows:
184 in Shanksville + 14,577 in New York City = 14,761 lives saved on September 11, 2001
If any reader has a more accurate way of estimating the lives saved at the WTC in New York City, please let me know.